

DATA HANDLING AND ANALYSIS
PART ONE: A STEP BY STEP GUIDE FOR THE COMPLETE BEGINNER
CONTENTS
WHAT IS DATA?
QUALITATIVE AND QUANTITATIVE DATA
RESEARCH METHODS THAT USE QUALITATIVE DATA FREQUENTLY: DISCOURSE ANALYSIS, THEMATIC ANALYSIS AND CONTENT ANALYSIS (SEE RESEARCH METHODS)
LEVELS OF MEASUREMENT
WHICH DESCRIPTIVE STATISTIC FOR WHICH DATA?
PRIMARY AND SECONDARY DATA
META-ANALYSIS

THE STORY OF DATA
To begin, let's clarify some definitions:
Singular: Datum
Plural: Data
In modern usage, "data" is commonly used to refer to both singular and plural forms.
Data is a term so ingrained in everyday language that its profound significance often goes unnoticed. Data allows us to systematically capture reality in a form that can be examined and utilised. The mechanism encompasses all facts and information, representing everything that can be quantified and measured. It is the foundation for structuring information into units that can be manipulated, described, and analysed. This conversion process is crucial for making sense of the information, enabling us to make predictions and inform decisions.
BUT NOT ALL DATA IS CREATED EQUALLY
The notion of data is diverse, covering a broad spectrum of types and depths of information. In scientific research, a significant portion of data is empirical and complex, constituting the bedrock of credible scientific investigation. However, it is essential to acknowledge that not all data possess the same level of objectivity. Data stemming from personal opinions, devoid of inherent numerical or objective properties, requires transformation by statisticians into a measurable format for further analysis. This form of data, known as qualitative data, is frequently utilised in psychology and other social sciences. Such research is often perceived with lesser regard within the scientific community than disciplines primarily relying on quantitative data. Quantitative data is directly measurable and numerical and enables parametric testing. For undergraduate students, grasping this differentiation is pivotal, as it underscores the varied nature of data and its significance across distinct scientific fields.
Lastly, comprehending the nature of one's data is essential in selecting the appropriate descriptive and inferential statistics. This understanding enables researchers to apply the most suitable statistical techniques for data analysis, ensuring their findings are valid, reliable, and accurately reflect the phenomena under investigation.
WHAT IS RAW DATA?
AKA: source data, atomic data, or unprocessed data
Raw data are the unprocessed, crude results of a study.
Raw data represents a study or observation's initial, untouched outcomes.
RAW DATA EXAMPLE:
In the following example, Participants rated photographs of the opposite sex on a scale of attractiveness from 1 to 10. Participants were randomly divided into two groups (independent group design). One group jogged on the spot for ten minutes while the other half performed the ratings without exercise. It was hypothesised that physical activity would increase ratings of attractiveness.
Below are the unprocessed responses from participants in both groups.
Q: Can you determine whether the hypothesis worked from reading the raw data below?
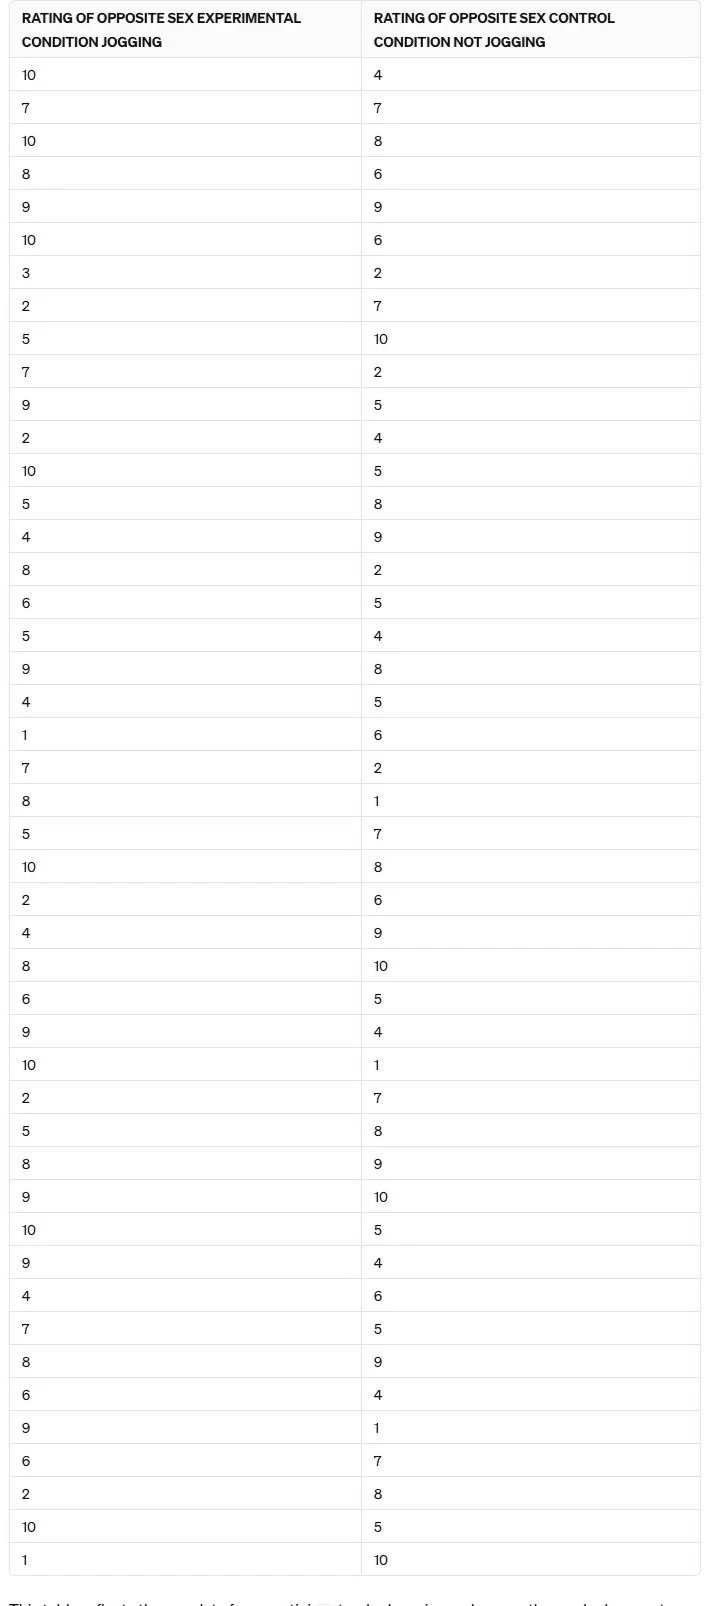
TABLE 1.
RAW DATA
From participants who have rated photographs of the opposite sex on a scale of attractiveness from 1-10; jogging and not jogging.
DATA VERSUS INFORMATION
Raw data in its original form is challenging to interpret and assess, making it difficult to determine the hypothesis's effectiveness. The sheer volume of numbers presents complex, cumbersome information to analyse and understand.
A pivotal distinction is frequently underscored between the concepts of data and information:
Data is initially presented as raw, unprocessed numbers and facts, devoid of context or interpretative framework.
Conversely, information emerges through the methodical processing of data, thereby endowing it with context, relevance, and meaning.
COOKED DATA:
Raw data has to undergo a cleaning process before any analysis occurs. During this phase, anomalies such as outliers are carefully identified and excised, while errors from instrument readings or data entry are diligently corrected. This pivotal step is fundamental in preserving the data's integrity and accuracy, paving the way for comprehensive analysis.
Applying descriptive statistics, such as means, medians, modes, ranges, and standard deviations, transforms processed data into descriptive data by summarising and methodically organising a dataset's characteristics so it significantly enhances comprehension.
WHAT IS QUALITATIVE DATA?
A straightforward approach to classifying data is to divide it into two main types: qualitative and quantitative.
Understanding Qualitative Research:
Qualitative research focuses on exploring the subjective aspects of human life, such as individuals' opinions, attitudes, motivations, and behaviours. It's primarily utilised for exploratory purposes, aiming to provide deep insights into complex issues or topics of interest. By investigating these areas, qualitative research helps reveal underlying trends, patterns, and hypotheses, which can later be examined more rigorously through quantitative methods.
Unlike quantitative data, which is numerical, qualitative data is non-numerical and cannot be measured by standard metrics.
Qualitative data captures the complex nuances of human experiences and attitudes through descriptive narratives. This type of research focuses on understanding the "why" behind human actions, thoughts, and feelings, relying on open-ended questions that allow participants to express themselves in their own words, whether verbally or in writing.
The core of qualitative research lies in its ability to explore the meanings people attribute to their experiences, emphasizing the context and depth of those experiences over numerical analysis. It's particularly effective in uncovering trends, motivations, and deeper insights into social and cultural phenomena. For example, in studying the impact of chronic illness, qualitative research can reveal not just the physical effects but the emotional and social ramifications on a person's life.
A key aspect of qualitative research is its setting in the participants' natural environments, such as homes, schools, or workplaces. This approach helps researchers understand how individuals and groups interact with and make sense of their world in real-time, offering a rich, contextual understanding of their behaviours and decisions.
Qualitative research doesn't aim to predict outcomes but to describe and explain human experiences. An example of this could be a study on how families navigate the challenges of remote learning, providing insights into the strategies they develop, the obstacles they face, and the overall impact on family dynamics.
This method values the depth and quality of data over quantification, making it indispensable for studies requiring a deep dive into subjective experiences and social context.
QUALITATIVE QUESTIONS ARE OPEN-ENDED
Open-ended questions invite detailed, personalised responses, allowing individuals to express their thoughts and experiences without the limitations of predefined options.
For example:
Why did you start smoking?…………………………………………………………………………………………………………………………………………………………………………………
How do you describe your experience with social anxiety in social settings? …………………………………………..
What strategies do you employ to cope with stress during challenging times? …………………………………………...
Can you share your journey of recovering from a traumatic event? …………………………………………..
How has your perception of self-worth changed over time, and what influenced these changes? …………………………………………..
What role has family support played in your mental health journey? ……………………………………………………………
How do you manage work-life balance, and what challenges have you faced in achieving it? …………………………………………..
These questions are designed to elicit detailed responses, providing deep insights into individuals' experiences, coping mechanisms, and perceptions related to psychological well-being) The participant can share a comprehensive story or list of reasons in their own words, highlighting personal experiences, influences, or circumstances that led to their decision to start smoking.
In contrast, closed questions restrict answers to specific, pre-determined choices, limiting the depth of response but facilitating easier quantification and data analysis.
Below are some examples of closed questions using quantitative data:
"How much do you weigh?" (Measured in pounds or kilograms)
"How tall are you?" (Measured in feet and inches or centimetres)
"What is your IQ score according to a standardized IQ test?"
"How many minutes do you meditate each day?"
"How many hours per week do you spend on cognitive training exercises?"
"At what age did you start walking as a child?" (Measured in months)
"How many minutes does it take to fall asleep after going to bed?"
"How many new words do you learn on average per week?"
"How many pages can you read in an hour?"
"How often a week do you experience a dream you remember?"
IQS of students in a psychology class:: 145 150 100 105 120 89 99 135 146 120 116 1
TYPES OF QUALITATIVE DATA
Qualitative data can be in descriptions, narratives, words, meanings, clichés, colloquialisms, euphemisms, and conversations.


To understand the next topic: “Levels of measurement”, you must understand DISCREET AND CONTINUOUS DATA. If you are unsure of these terms, please click here
LEVELS OF MEASUREMENT
NOT ALL DATA IS CREATED EQUALLY
Consider the difference between data gathered from subjective opinions versus objective facts.
Example:
Objective Measurement: A room's temperature is measured at 20°C. A thermometer can verify this precise, objective measurement.
Subjective Opinion: Person A feels the room is too cold, while Person B finds it comfortably warm. These feelings are subjective opinions and can vary significantly from person to person, even though the objective temperature is the same for everyone in the room.
When we compare data derived from subjective opinions to that from objective facts, we're looking at two fundamentally different types of information. Subjective data is based on personal feelings, tastes, or opinions. It's qualitative, meaning it describes qualities or characteristics that can't be measured numerically in a direct way. For instance, asking people how much they enjoy a particular movie might elicit a range of responses based on individual tastes, which can be recorded on a scale but are inherently subjective and categorical. Another example is asking individuals to rate their happiness on a scale from 1 to 10. Each person's rating is influenced by unique experiences, expectations, and perceptions, making it inherently subjective. Subjective data captures personal perspectives and can vary widely from person to person, while
On the other hand, objective data refers to measurable, observable, and verifiable information. This quantitative data type relies on numerical measurements that different observers can consistently and independently verify. An example of objective data could be the height of individuals, measured in inches or centimetres. This data is factual and does not change based on personal feelings or opinions. Objective data documents measurable facts that are consistent and independent of individual viewpoints.
Understanding the distinction between subjective opinions and objective facts is crucial in research and data analysis, as it influences how data is collected, interpreted, and applied.
Research producing qualitative, categorical insights is not inherently mathematical or orderly. On the other hand, quantitative, continuous data, which is numerical and can be ordered or measured, is often viewed with higher integrity and validity.
WHAT ARE THE DIFFERENT LEVELS OF MEASUREMENT
In statistics, levels of measurement are just a complicated way of saying, "What type of data do I have?
Levels of measurement" distinguish between types of data based on their precision, mathematical validity and collection method. It is a system that organises data into categories,
There are four categories of data
NOMINAL
ORDINAL
INTERVAL
RATIO
Stanley Smith Stevens introduced four measurement scales in 1946, which remain foundational in data analysis. These scales—nominal, ordinal, interval, and ratio—varied in the degree of detail and mathematical structure, influencing the interpretation of data and the statistical tests that could be employed. Stevens believed understanding the data's measurement level was crucial for selecting the appropriate statistical test.
The levels of measurement—nominal, ordinal, interval, and ratio—represent a hierarchy in terms of the sophistication of the information they convey about the data. This hierarchy often leads to a perceived progressive order of respect or value in statistical analysis and research for several reasons:
Nominal Level
Description: The nominal level of measurement categorizes data without any quantitative value or order. Examples include gender, race, or the presence/absence of a characteristic.
Limitations: It is considered the most basic level because it only allows for categorization and does not provide information about the order, differences between categories, or ratios. This limitation restricts the types of statistical analyses that can be meaningfully applied (e.g., mode, frequency counts).
Perceived Respect: Nominal data is sometimes considered less "respectable" because it offers the least information about the relationships between data points.
Ordinal Level
Description: Ordinal data provides a rank order among categories but does not quantify the differences between ranks. Examples include socioeconomic status (low, medium, high) or education level.
Limitations: While ordinal data adds the dimension of order, it still lacks precise information about the magnitude of differences between ranks, limiting the statistical methods that can be used (e.g., median, non-parametric tests).
Perceived Respect: Considered a step above nominal due to the added information about the order, but still limited in the depth of data interpretation it allows.
Interval Level
Description: Interval data has both order and equal intervals between values but lacks a true zero point, making ratios meaningless. Temperature in Celsius or Fahrenheit is a classic example.
Advantages: This level allows for more sophisticated statistical analyses, including those involving mean and standard deviation, because it supports operations based on distance.
Perceived Respect: Gains more respect due to the ability to perform a wider range of statistical analyses, reflecting more nuanced differences in the data.
Ratio Level
Description: Ratio data possesses all the properties of interval data, with the addition of a meaningful zero point, allowing for the computation of ratios. Examples include weight, height, and income.
Advantages: It is the most informative level, supporting the broadest range of statistical analyses, including those requiring multiplication and division (e.g., geometric mean, coefficient of variation).
Perceived Respect: Considered the highest level of measurement because it provides the most comprehensive information about the data, including the ability to make full use of arithmetic operations.
The perceived progression from nominal to ratio levels stems from the increasing complexity and informational content of the data as you move up the levels. Each higher level retains the properties of the lower levels while adding new characteristics, allowing for more sophisticated and meaningful analyses. This hierarchy underscores the importance of understanding the level of measurement when choosing statistical methods and interpreting data, as it directly impacts the validity and depth of the insights that can be drawn.
VALIDITY AND RELIABILITY OF DIFFERENT LEVELS OF MEASUREMENT
Reliability and validity are critical concepts in measurement, impacted by the level of measurement used. Higher levels of measurement, such as interval and ratio, which permit detailed statistical analysis, generally offer increased reliability. This is because measurements like temperature or weight can be precisely replicated, given a controlled measurement process. In contrast, nominal and ordinal scales, though useful for categorization, may be less reliable due to their susceptibility to interpretation errors, as seen in subjective classifications like socioeconomic status.
Validity, or the extent to which a measure accurately reflects its intended purpose, also varies with the level of measurement. Interval and ratio data are often more valid for quantitative constructs because they provide exact quantification closely aligned with the measured concept, such as height for physical stature. On the other hand, nominal and ordinal scales may face validity challenges in measuring complex concepts, like disease classification not reflecting severity or progression, thereby affecting understanding a disease's health impact.
HOW TO RECOGNISE THE LEVEL OF MEASUREMENT IN DATA
The easiest way to categorise which level of measurement any data is to ask the following two questions:
Are the gaps between the variables/numbers mathematical (e.g., of equal value and objective)?
Can you order the data from smallest to largest?
KEY CONSIDERATIONS IN DATA CATEGORISATION: FOCUS ON THE RESEARCH PARTICIPANTS' ACTIONS
When determining the categorisation of your data, it's crucial to examine the participants' activities within the context of your research. Assess the nature of the tasks they undertake or the types of questions they respond to, whether in experiments (considering the dependent variable) or through questionnaires. Attempting to classify your data based solely on the final, quantified scores might mislead you into categorising it as interval or ratio data. This misconception arises because raw data is typically converted into numerical form for analysis by the end of the research process. However, the true nature of your data – and its corresponding level of measurement – is more accurately determined by examining the initial, unprocessed responses and actions of your research participants.
This nuanced approach ensures that you categorise your data correctly, reflecting the actual processes and responses involved in your research rather than the numerical representation of these responses.
Let’s take a look at these measurement scales!
NOMINAL DATA

.
When we ask a simple question like "Do you like cheese?" and give options "Yes," "No," or "Maybe," the type of answers we get don't line up in a clear order. For example, "Maybe" doesn't come before or after "Yes" or "No" in a way that makes sense number-wise. This shows us that these answers belong to a category where they're just different choices without ranking. It's like putting different types of fruit in a basket without worrying about which is better or worse.
So, if one person says "Maybe" and another says "Yes" to liking cheese, we can't say one answer is higher or lower than the other. They're just different opinions or choices. This kind of data is about sorting answers into groups without putting them in a specific order, unlike numbers where we can see what's more, less, or equal.
DO YOU LIKE CHEESE?: YES NO MAYBE
PARTICIPANT A: MAYBE
PARTICIPANT B: YES
The responses from PARTICIPANT A and PARTICIPANT B can't be arranged in a sequence since "maybe" isn't higher or lower than "yes," the same goes for the other options. Essentially, there's no specific sequence for YES, NO, and MAYBE choices.
The term "nominal" derives from the Latin word "nomen," which means "name." Thus, nominal data refers to a category of qualitative data that organizes information into distinct categories. These categories function as nouns or labels; they are entirely descriptive, lacking quantitative or numeric significance, and the various categories cannot be arranged in a progressive sequence or hierarchy. A fundamental instance of nominal data is the dichotomy of "yes" or "no." Although these represent two distinct categories, no method exists to rank them in terms of highest to lowest or best to worst.
Nominal data, or categorical data, represents the most basic data type in statistics. The assignment of numbers to categorize or label variables, such as types of pets, employs these numbers solely as identifiers. They do not possess mathematical significance nor suggest any ranking among the categories. For example, in gathering data about family pets, if one assigns 1 to dogs, 2 to cats, 3 to rabbits, etc., this does not imply that rabbits (3) hold a higher status than dogs (1). The use of numerical labels in this context serves merely for the ease of data handling and does not reflect any intrinsic worth or hierarchical order
SIMPLICITY AND SUBJECTIVITY
Nominal data often captures subjective responses that cannot be quantitatively measured. While psychologists may assign numbers to these responses for analytical convenience, such quantification does not enhance our understanding of the data's nature. For example, knowing the number of participants who prefer dogs over guinea pigs doesn't quantify the degree of preference.
LACK OF ORDER
This characteristic of nominal data means that categories are classified without any natural sequence. Whether 'dogs' are listed before 'hamsters' or 'yes' comes before 'no' is irrelevant because the order does not affect the data's meaning or interpretation.
CATEGORISATION AND FREQUENCY
Nominal data is primarily about categorisation and counting occurrences. It's used to tally how often a particular choice is made, such as the frequency of 'yes' or 'no' responses in survey questions.
QUESTION FORMAT
Questions designed to collect nominal data are typically closed-ended, providing respondents with a set of predefined options to choose from.
DESCRIPTIVE STATISTICS
When analysing nominal data, the focus is on frequency distribution and modes—the most common categories within the dataset. Measures of dispersion that require ranked data, like range or standard deviation, do not apply to nominal data due to its unordered nature.
Nominal data's strength lies in its ability to simplify complex qualitative information into distinct categories, making it indispensable for various research fields, particularly in psychology, where understanding patterns in categorical variables can provide significant insights
NOMINAL DATA TYPE QUESTIONS:
Please circle any reason from below that encouraged you to take drugs
PEER-PRESSURE STRESS COPIED-SOMEONE-YOU-ADMIRED BOREDOM TO-LOSE-WEIGHT TO-LOOK-COOL OTHER
Do you like cheese? YES NO MAYBE
MEAL PREFERENCE:
EGG-SANDWICH CHICKEN-SOUP GREEK-SALAD
RELIGIOUS PREFERENCE:
1 = BUDDHIST, 2 = MUSLIM, 3 = CHRISTIAN, 4 = JEWISH, 5 = OTHER, 6= ATHEIST, 7 = AGNOSTIC
POLITICAL ORIENTATION:
LEFT-WING, COMMUNIST, TORY, FASCIST, DEMOCRATIC, REPUBLICAN, LIBERTARIAN, GREEN
EXAMPLES OF NOMINAL DATA
ADVERTISING IN LONELY HEART ADS: How often do females versus males highlight looks or status in their advertisements? This involves categorising ads based on the content focus without implying any hierarchy between the focuses.

RELATIONSHIP STATUS” Relationship status options: single, married, cohabiting, divorced
ATTACHMENT STYLE: Attachment styles: secure, avoidant, ambivalent, disorganised.
PERSONALITY TYPE: Personality types, emotional stability, ambivert, extrovert, introvert, and neurotic,
COLLECTING NOMINAL DATA IN PSYCHOLOGY
Psychologists collect nominal data by categorising information without implying hierarchy or quantitative value. This involves using surveys or questionnaires with predefined options to gather information on various topics, such as learning styles, demographic details like gender or ethnicity, and specific behaviours or traits. For example, a survey might ask participants to select their preferred learning style from visual, auditory, or kinesthetic options, each representing a distinct category with no inherent order. This method allows researchers to effectively identify and analyse different groups or characteristics within their studies.
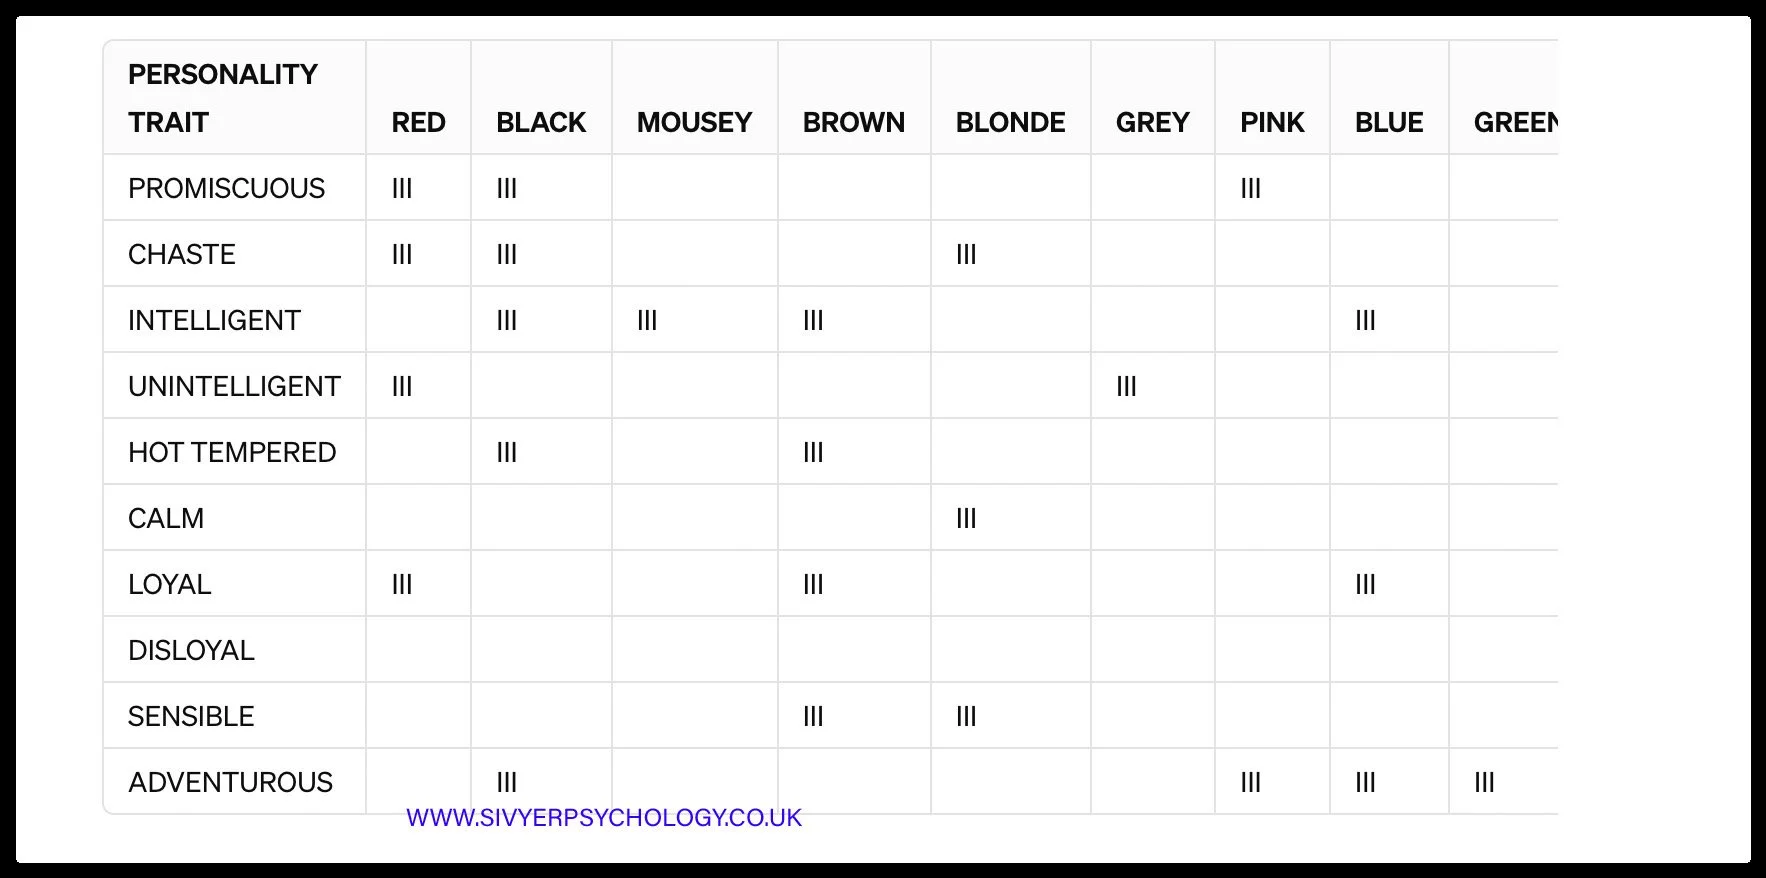
DO PEOPLE STEREOTYPE FEMALES BY THEIR HAIR COLOUR?
Using the examples listed above, answer the following two questions:
Are the gaps between NOMINAL DATA mathematical (e.g., of equal value and objective)?
Can you order NOMINAL DATA from smallest to largest ?
ORDINAL DATA

When asking a question like, "Do you like cheese?" and offering a scale from "Least" to "Most" (1 to 10), responses from different participants can be compared numerically. If one participant scores a six and another a 3, these preferences have a clear numerical order and magnitude.
DO YOU LIKE CHEESE?
LEAST -1 2 3 4 5 6 7 8 9 10 - MOST
PARTICIPANT A :
LEAST -1 2 3 4 5 6 7 8 9 10 - MOST
PARTICIPANT B:
LEAST -1 2 3 4 5 6 7 8 9 10 - MOST
The answers given by PARTICIPANT A and CANDIDATE B have a progressive order because six is bigger than 3
SUBJECTIVITY AND INEQUALITY IN GAPS
Ordinal rankings reflect subjective opinions, making the intervals between ranked positions imprecise. A participant’s rating of 10 on a likability scale for cheese is subjective; for one person, it might mean an exclusive cheese diet, while for another, it simply indicates a strong preference. Thus, the perceived "distance" between rankings can vary significantly between individuals.
Here is another similar example:
HOW MUCH DO YOU LIKE JOHNNY DEPP?
LEAST -1 2 3 4 5 6 7 8 9 10 - MOST
PARTICIPANT A:
LEAST -1 2 3 4 5 6 7 8 9 10 - MOST
PARTICIPANT B:
LEAST -1 2 3 4 5 6 7 8 9 10 - MOST
When participants rate their liking for Johnny Depp on a scale from "Least" to "Most" (1 to 10), the numerical distance between their responses might not hold the same objective meaning. A 5-point difference in preference doesn't convey a precise mathematical gap because subjective feelings and opinions, unlike height, aren't measured against a universally consistent scale. For instance, a participant rating Johnny a ten might not be familiar with Depp's movies. At the same time, another who rated him a five could be an avid fan but not consider themselves obsessed. This highlights how some aspects of quantitative data, particularly when measuring subjective experiences or opinions, might not always align with the mathematical precision found in measurements of physical attributes.
Numbers in ordinal data merely signify a sequence rather than a quantitative value.
ORDINAL DATA UNPACKED
Ordinal data offer a nuanced approach to capturing preferences, opinions, and states in psychological research, bridging the gap between the simple categorization of nominal data and the precise measurement of interval and ratio data.
NATURE AND COLLECTION
Ordinal data capture subjective opinions often gathered through surveys or questionnaires. Unlike nominal data, which categorises without order, ordinal data inherently ranks responses, providing a hierarchy among the choices.
QUESTION FORMAT
Questions designed to collect ordinal data are typically closed-ended, asking respondents to choose from a set scale that reflects a range of opinions or states.
DATA COLLECTION EXAMPLES
Ordinal data is collected using scales that allow respondents to rank their responses in a specific order, indicating relative positions or preferences but not the exact magnitude of difference between them. Here are some common scales used to measure ordinal data, particularly in psychology and social sciences:
Likert Scale: One of the most widely used scales for measuring attitudes, opinions, or perceptions. Respondents indicate their level of agreement or disagreement on a symmetric agree-disagree scale for a series of statements. Typically, it ranges from "Strongly agree" to "Strongly disagree," with a neutral option.
Attitude Scales: While the Likert scale is an attitude scale, there are other formats. Attitude scales measure the intensity of a person's feelings towards an object, issue, or situation. They often use ordered categories to capture the degree of a respondent's attitude.
Ordinal Scale: This general category includes any scale where responses are ranked in a specific order, but the intervals between ranks are not necessarily equal. Besides Likert and attitude scales, ordinal scales can be as simple as ranking preferences (e.g., first choice, second choice, third choice).
Semantic Differential Scale: Unlike the Likert scale, which uses a single dimension (agree-disagree), the semantic differential scale measures attitudes across multiple dimensions of meaning. It presents a series of bipolar adjectives (e.g., "Good-Bad," "Happy-Sad") and asks respondents to rate the subject on a scale between them.
Guttman Scale: Also known as the "scalogram analysis," this scale measures the intensity of a respondent's feeling towards a topic. Respondents are presented with items of increasing difficulty or intensity. The assumption is that agreeing to a more intense statement implies agreement with less intense statements.
Stapel Scale: This scale measures attitudes by asking respondents to rate how closely and in what direction a descriptor fits a subject using a numerical scale typically ranging from -5 to +5, without a neutral point. It differs from the Likert scale by not using agreement statements but rather adjectives to assess attitudes.
DESCRIPTIVE STATISTICS FOR ORDINAL DATA
APPLICABLE MEASURES
Ordinal data analysis can employ frequency distribution, mode, and median to describe the central tendency, with the range and inter-quartile range providing insights into variability. The interquartile range is particularly valuable as it gives a more detailed view of the distribution's middle spread, sidestepping the issue of uneven intervals between ranks.
ORDINAL DATA TYPE QUESTIONS:
Q: Do you like cheese?
NOT AT ALL, NOT MUCH, IT’S OK, IT’S QUITE NICE. I LOVE IT
Or number scales
Q: Do you like cheese?
LEAST -1 2 3 4 5 6 7 8 9 10 - MOST
Q: Why did you start smoking?
Please circle the number below.
PEER-PRESSURE
LEAST -1 2 3 4 5 6 7 8 9 10 - MOST
STRESS
LEAST -1 2 3 4 5 6 7 8 9 10 - MOST
COPIED-SOMEONE-YOU-ADMIRED
LEAST -1 2 3 4 5 6 7 8 9 10 - MOST
BOREDOM
LEAST -1 2 3 4 5 6 7 8 9 10 - MOST
TO-LOSE-WEIGHT LEAST -1 2 3 4 5 6 7 8 9 10 - MOST
TO-LOOK-COOL
LEAST -1 2 3 4 5 6 7 8 9 10 - MOST
Q: How much do you like Italian food? Please circle a response below
NOT AT ALL, NOT MUCH, IT’S OK, IT’S QUITE NICE. I LOVE IT
Q: How much do you like Thai food? Please circle a response below
LEAST -1 2 3 4 5 6 7 8 9 10 - MOST
ORDINAL SCALES
Ordinal data organises elements based on a ranked order or hierarchy, though the exact distance between these ranks is not necessarily known or equal. Here are examples that illustrate ordinal data in various contexts:
LIKERT SCALE SURVEYS: Directly, ordinal data is often gathered through surveys using Likert scales that assess attitudes or feelings, such as "To what extent do you feel stressed?" with options ranging from "Not at all" to "Extremely." Responses indicate a rank order of stress levels without specifying their precise differences.
CLINICAL ASSESSMENT SCALES: Clinical assessments for mental health symptoms often utilise ordinal scales. For example, the severity of depression might be rated from "Mild" to "Severe," categorising the extent of symptoms in a hierarchical order.
MATING PREFERENCE STUDIES: Evolutionary psychologists may rank preferences or behaviours according to their perceived importance in mate selection, generating ordinal data. Participants could rank traits like "physical attractiveness" and "financial stability" from least to most important without indicating the exact difference between ranks.
TASK PERFORMANCE LEVELS: Cognitive experiments often rate performance using ordinal scales. For instance, memory recall ability might be categorised as "Poor," "Fair," "Good," or "Excellent," reflecting a ranked order of performance without quantifiable intervals.
RESPONSE STRENGTH: In behaviourist studies, response to stimuli can be ranked by strength or frequency. For example, an animal's response to training cues might be ranked from "Weak" to "Strong," providing ordinal data on the effectiveness of conditioning.
Using the examples listed above, answer the following two questions:
Are the gaps between ORDINAL DATA mathematical (e.g., of equal value and objective)?
Can you order ORDINAL DATA from smallest to largest?
INTERVAL DATA

TAKE THE FOLLOWING HEIGHTS
FRANK: "6'9"
BLUE: "6'7”
DOLLY "6'5"
Consider measuring heights in inches, such as Frank being 6'9", Blue at 6'7", and Dolly at 6'5". These measurements show a consistent mathematical interval of 2 inches between each individual, providing a clear, objective representation of quantifiable differences. The uniform gap of 2 inches between Dolly and Blue is precisely the same as the 2 inches between Frank and Blue. This consistency underscores the nature of interval data as an objective, measurable fact, perfectly illustrating the concept of interval data where the differences between measurements are meaningful and uniformly spaced.
INTERVAL DATA: DEFINITION AND APPLICATIONS
Interval data enriches research in fields such as psychology, education, and the sciences by providing a framework for quantifying and analysing variables with mathematical rigour, albeit with specific limitations regarding ratio calculations and the interpretation of zero.
CONSISTENCY IN INTERVAL DATA: It's important to recognize that interval data is characterized by equal, mathematical intervals that remain consistent across the measurement scale. This means that the difference between any two points is objective and uniformly applies throughout the range of data. For instance, consider the heights of three individuals: Ralphie at 5'9", Frank at 5'11", and Blue at 6'. This scenario demonstrates that the intervals between their heights are equal and stable, illustrating the essence of interval data. Unlike with continuous data, where measurements can vary more fluidly, interval data ensures that each unit of measurement—each inch in this case—represents the same difference no matter where it occurs on the scale. Examples include IQ scores, pulse rates, and memory scores, where each unit of measurement is consistently spaced from the next.
QUANTITATIVE NATURE
Interval data is numerical, grouping variables into categories along a progressive scale. Each increment, such as those on Fahrenheit or Celsius temperature scales, is equally spaced, allowing for detailed mathematical operations and comparisons.
PRECISION AND LACK OF TRUE ZERO
What sets interval data apart is its precision due to its mathematical basis. However, a distinctive trait of interval scales is their lack of a 'true zero.' Zero does not indicate an absence but is a point within a range of values, including potential negative values, such as temperatures below zero Celsius.
COMPLEXITY AND UTILITY
As the third most complex level of measurement, interval data introduces numerical values that enhance the scope for statistical analysis far beyond the capabilities of nominal and ordinal data. Despite their similarities, interval data is differentiated from ratio data by the inability to make meaningful ratio comparisons due to the absence of a true zero point.
STATISTICAL ANALYSIS AND GRAPHICAL REPRESENTATION
Descriptive Statistics: Interval data supports all measures of central tendency and dispersion, with standard deviation often preferred for its precision. However, the interquartile range may offer a more accurate picture of variability in datasets with extreme scores or skewness.
Graphical Representations: Line graphs and histograms are suited to interval data, effectively illustrating trends and distributions within the data.
INTERVAL DATA QUESTIONS:
Question: What is your IQ? Possible answers: - 70 80 90 100 110 120 130 140 150 160
Please note the gap between the IQ scores has an objective mathematical interval that means the same throughout the measurement.
EXAMPLES OF INTERVAL DATA
STANDARDISED TESTS SUCH AS IQ TESTS: These assessments are prime examples of interval data because the scoring scale is arbitrarily defined. The difference between consecutive scores is consistent, illustrating equal intervals. However, a score of zero does not denote the absence of the attribute being measured (e.g., intelligence), distinguishing these scores as interval data.
SURVEYS AND QUESTIONNAIRES WITH LIKERT SCALES: Responses on Likert scales, typically ranging from "Strongly Disagree" to "Strongly Agree," offer interval data. Although these scales use numbers, they represent fixed intervals between attitudes or feelings without implying a true zero point, classifying them firmly within the interval data category.
COMPARATIVE ANALYSES ACROSS SPECIES: When traits or behaviours are quantified on a scale, such as levels of aggression, the data is considered interval. The scales start at an arbitrary point, lacking a true zero, focusing on relative differences rather than absolute magnitudes.
NEUROIMAGING DATA MEASUREMENT: Neuroimaging techniques produce interval data due to the equal, meaningful intervals between measurement points and the absence of a true zero. For instance, a zero in fMRI data means no brain activity but a baseline activity level.
REACTION TIMES IN COGNITIVE TASKS: The analysis of reaction times is based on the intervals between stimuli and responses. Although technically, there could be a zero response time, in practice, the emphasis is on the difference in times across conditions, making this interval data.
BEHAVIOUR RATE MEASUREMENT: Measuring the frequency of a specific behaviour within a set time frame generates interval data. The lack of a true zero (indicating non-occurrence) and the focus on rate differences highlight the interval nature of such measurements.
STIMULUS INTENSITY LEVELS: Scaling stimulus intensities (e.g., for sound or light) in equal intervals without a meaningful zero point (absolute silence or darkness) exemplifies interval data collection in behaviourist studies.
Using the examples listed above, answer the following two questions:
Are the gaps between INTERVAL DATA mathematical (e.g., of equal value and objective)?
Can you order INTERVAL DATA from smallest to largest?
RATIO DATA
AQA doesn’t require students to distinguish between interval and ratio data.
CONSISTENCY IN RATIO DATA: EQUAL AND STABLE INTERVALS
Ratio data is distinguished not only by its equal mathematical intervals but also by the presence of a true zero point, offering a level of measurement that supports both difference and proportion. This ensures that the difference between any two measurements is objective and consistently applies across the data range, providing a firm basis for comparison and analysis.
EXAMPLE OF RATIO DATA
Take, for example, the heights of three individuals: Ralphie at 5'9", Frank at 5'11", and Blue at 6'. In this case, the intervals between their heights are equal and stable, a hallmark of ratio data. This stability allows for meaningful calculations beyond simple differences, such as proportions and ratios. For instance, Blue's height is not only taller in a comparative sense but can also be quantitatively compared to Ralphie's and Frank's heights using ratios.
RATIO DATA VERSUS INTERVAL DATA: UNDERSTANDING THE DISTINCTION
While ratio and interval data provide structured and consistent measurements, their fundamental difference lies in a true zero point's presence (or absence). This distinction is crucial for conducting analyses that involve proportions or absolute comparisons, particularly in psychological research.
TRUE ZERO IN RATIO DATA
A true zero point in psychological settings allows for meaningful statements about quantities doubling or halving. For instance, consider measuring the daily stress-related behaviours observed in individuals. If one individual exhibits 0 stress-related behaviours (indicating a complete absence) and another exhibits 10, you could meaningfully say the second individual displays infinitely more stress-related behaviours than the first, thanks to a true zero in ratio data.
LACK OF TRUE ZERO IN INTERVAL DATA
Temperature in Celsius or Fahrenheit: At 0 degrees, the temperature is defined but not absent. Temperatures can drop below zero, demonstrating that this zero is not a true absence of temperature.
Contrastingly, interval data's lack of a true zero makes such proportionate comparisons unfeasible. An example of interval data in psychology could be using a standard mood scale ranging from -5 for extremely sad to +5 for extremely happy, with 0 representing a neutral mood. Saying that a mood score of +4 is "twice as happy" as a score of +2 misinterprets the data because the zero point does not signify the absence of mood but rather a neutral midpoint. The scale measures mood intensity in equal intervals but without a true absence of mood, making proportional comparisons like "double" inapplicable.
MORE SCENARIOS
Consider a scenario where participants rate their anxiety on a scale from 0 (no anxiety) to 10 (extreme anxiety). If one participant rates their anxiety as two and another as 4, it would be misleading to say the latter's anxiety is "twice" the anxiety of the former. This is because the scale, while appearing to offer a starting point of zero, actually measures intensity in a way that doesn't allow for true proportional comparisons. The 'zero' here does not represent an absolute lack of anxiety (as some baseline anxiety might always be present), illustrating how interval data's lack of a true zero complicates statements about doubling or halving in a psychological research context.
The true zero point in ratio data is crucial for its interpretation. It signifies the absence of the quantity being measured. In the height example, a height of 0 would theoretically indicate the absence of height, underscoring the concept of a true zero.
Weight: Zero is a classic example where zero has concrete meaning. Zero weight means nonexistence, which allows for direct comparisons, such as one object being twice as heavy as another.
PRACTICAL APPLICATION OF TRUE ZERO
True zero in ratio data doesn't imply that every measurement must reach zero. It indicates that the scale used allows for the possibility of reaching an absolute zero, even if such measurements are uncommon in practice, like adults' heights not frequently below 5 feet.
GRAPHICAL REPRESENTATIONS AND STATISTICS
Graphs: Ratio data can be effectively presented using line graphs or histograms. These formats accommodate the equal intervals and true zero of ratio measurements, illustrating trends and distributions.
Descriptive Statistics: Ratio level data supports all measures of central tendency (mean, median, mode) and dispersion (range, variance, standard deviation). Standard deviation is often preferred for its precision in reflecting variability. However, the interquartile range may be more informative in datasets with outliers or skewness, providing a more robust measure of spread.
Ratio data's comprehensive nature allows it to support various statistical analyses, from basic descriptive statistics to complex inferential techniques, making it highly valuable across diverse research domains.
DIRECT AND INDIRECT MEASUREMENTS
In psychology and its subfields, ratio data is gathered through direct and indirect measurements. This approach allows researchers to quantify variables with a true zero point, enabling precise comparisons and analyses.
COLLECTING RATIO DATA IN PSYCHOLOGY
BEHAVIOURAL OBSERVATIONS: Directly observing and recording the frequency of specific behaviours (e.g., smiles, aggressive acts) provides ratio data. The true zero point indicates the absence of the behaviour, and each occurrence is counted, offering exact quantifiable differences.
SELF-REPORT SURVEYS: Indirectly, surveys asking about quantifiable life aspects (e.g., number of weekly exercise hours) gather ratio data. Though self-reported, these measures assume a true zero (no hours spent exercising) and allow for precise enumeration.
GENETIC VARIATION STUDIES: Researchers can quantify variations directly by analysing genetic markers. Indirect measures include surveying traits believed to have evolutionary bases, with data ranging from zero (absence of the trait) upwards.
NEUROIMAGING TECHNIQUES: Direct measurements of brain activity (e.g., using fMRI) yield ratio data, such as the volume of brain regions. Indirectly, cognitive tests measuring memory or attention provide ratio data by counting correct responses or reaction times, starting from a true zero of no responses or instantaneous reaction.
EXPERIMENTAL TASKS: Directly measuring the rate of responses in conditioning experiments, where zero indicates no response, exemplifies ratio data collection. Indirectly, theoretical models predicting behaviour frequencies under different conditions are tested and quantified, assuming a zero baseline for non-occurrences.
Considerations
While IQ scores and credit scores may seem like interval data due to their arbitrary scales, they can be argued to fit the ratio category if the scale starts at a meaningful zero that represents the absence of the trait being measured. However, the classification can depend on the measurement context and the zero-point interpretation.
Political orientation and other similarly constructed scales can blur the line between interval and ratio data, primarily based on whether the scale's zero point is considered to carry an absolute absence of the trait or merely a position within a spectrum.
CONCLUSIONS
The consistency and the presence of a true zero point in ratio data allow for precise, objective comparisons across a dataset, enhancing the depth and reliability of statistical analysis in fields that rely on quantitative measurements.
Using the examples listed above, answer the following two questions:
Are the gaps between RATIO DATA mathematical (e.g., of equal value and objective)?
Can you order RATIO DATA from smallest to largest?
HOW CAN CLOSED QUESTIONS BE QUALITATIVE DATA?
TURNING OPINIONS INTO MATHS
The classification of data into qualitative or quantitative categories often revolves around the nature of the data itself—whether it's numeric and quantifiable or descriptive and categorical. Here's a clarification on how nominal and ordinal data fit within these definitions and why they are considered qualitative despite sometimes being presented in a structured or "closed" format:
Qualitative Data: This type of data describes attributes or characteristics that are not inherently numeric. Qualitative data is often textual or categorical, capturing observed rather than measured qualities. The key aspect of qualitative data is that it focuses on elements' nature or quality rather than quantity.
Quantitative Data: This type involves numbers and values that can be measured and counted. It deals with quantities and includes anything that can be quantified, including amounts, volumes, sizes, and frequencies. Quantitative data allows for mathematical calculations and statistical analysis.
HOW NOMINAL AND ORDINAL DATA FIT IN
NOMINAL DATA: Although nominal data might be coded with numbers (e.g., 1 for male, 2 for female), these numbers do not hold mathematical value but are simply labels for categories. Using numbers is for convenience in data analysis rather than an indication of quantity or order. Hence, nominal data is qualitative because it describes categories or characteristics without implying quantitative measurement or inherent ranking.
Q: WHY DID YOU START SMOKING?
A: PEER-PRESSURE STRESS COPIED-SOMEONE-YOU-ADMIRED BOREDOM TO-LOSE-WEIGHT TO-LOOK-COOL OTHER
ORDINAL DATA: Ordinal data represents categories with a natural order or sequence (e.g., satisfaction levels, class ranks), but the intervals between these ranks are not necessarily equal or quantifiable. Although ordinal data appears closer to quantitative data due to its order, it remains qualitative at its core because the focus is on the order of categories rather than the precise measurement or distance between them. The numbers used in ordinal data rank order rather than measure exact quantities.
How much do you like Italian food? Please circle a response below
NOT AT ALL, NOT MUCH, IT’S OK, QUITE NICE. I LOVE IT
How much do you like Thai food? Please circle a response below
LEAST -1 2 3 4 5 6 7 8 9 10 - MOST
CLARIFICATION:
The distinction between qualitative and quantitative data doesn't solely depend on whether the data can be counted but on what the data represents. Qualitative data, including nominal and ordinal data, can be structured or come in "closed" questions (e.g., multiple-choice questions and Likert scales for ordinal data). The categorisation as qualitative stems from the nature of the information these data types convey—qualities, characteristics, or categories—rather than numerical values or quantities that can be mathematically manipulated.
Thus, even though nominal and ordinal data might be organized to allow for counting (e.g., how many respondents chose each category), they are considered qualitative because they fundamentally describe characteristics or categories, not quantities.
LEVELS OF MEASUREMENT USED IN PSYCHOLOGICAL RESEARCH
In psychology research, various measurement scales capture a wide range of data, from the categorical classification of mental health disorders to the precise quantification of physiological responses. Here's an expanded look at these methods with more examples, focusing particularly on why mental health diagnosis is considered nominal and how other psychological measures fit into the nominal, ordinal, interval, and ratio scales.
Nominal Scale and Mental Health
Mental Health Diagnoses: Diagnoses of mental health conditions, such as those categorized in the DSM (Diagnostic and Statistical Manual of Mental Disorders) and ICD (International Classification of Diseases), are examples of nominal data—these classifications group individuals based on the presence or absence of symptoms that define a particular disorder. The categories themselves do not imply a hierarchy or order; a diagnosis of depression is not "higher" or "lower" than anxiety but simply different.
Gene Sequencing: While highly technical, gene sequencing in psychology research can be nominal when identifying the presence or absence of specific genetic markers linked to psychological traits or disorders.
Blood Pressure: Although blood pressure measurements are ratio data due to their numerical nature and true zero point, the classification of blood pressure as normal, elevated, or stages of hypertension for risk assessment purposes can be considered nominal.
Ordinal Scale
Global Assessment Rating Scale: This scale assesses an individual's overall level of functioning. While it ranks individuals on a continuum from well to ill, the exact differences between ranks are not uniform or quantifiable.
Eating Attitude Test: Surveys like this often use Likert scales, providing ordinal data where responses indicate a level of agreement or severity but not precise intervals between responses.
Interval Scale
IQ Tests: Intelligence Quotient (IQ) scores are interval data because they have equal intervals between scores but no absolute zero point. An IQ of 100 is not twice that of an IQ of 50.
Scanning Techniques: Methods like fMRI provide interval data when measuring brain activity levels. The measurements can compare relative activity levels between different brain areas but don't have a true zero point of "no brain activity."
Ratio Scale
Pupil Dilation and Galvanic Skin Response: These physiological measures provide ratio data, with pupil size measurements or skin conductance levels that include a true zero point (e.g., no conductance).
Reaction Times in Experiments: Measured in experiments like the Bobo Doll or Milgram's obedience study, reaction times offer precise, quantifiable measurements from zero upwards, allowing for ratio comparisons.
Special Cases and Considerations
Concordance Rates: Often used in twin studies, concordance rates indicate the probability that both twins exhibit the same trait or disorder. While the calculation might seem ratio, the underlying classification (whether or not each twin has the condition) is nominal.
Strange Situation: This attachment theory experiment classifies infant behaviour into types, a nominal categorization. However, any numerical data derived from the experiment, like the duration of certain behaviours, could be a ratio.
Finger Length: The measurement of finger lengths provides ratio data, including a true zero and allowing for precise, quantifiable comparisons.
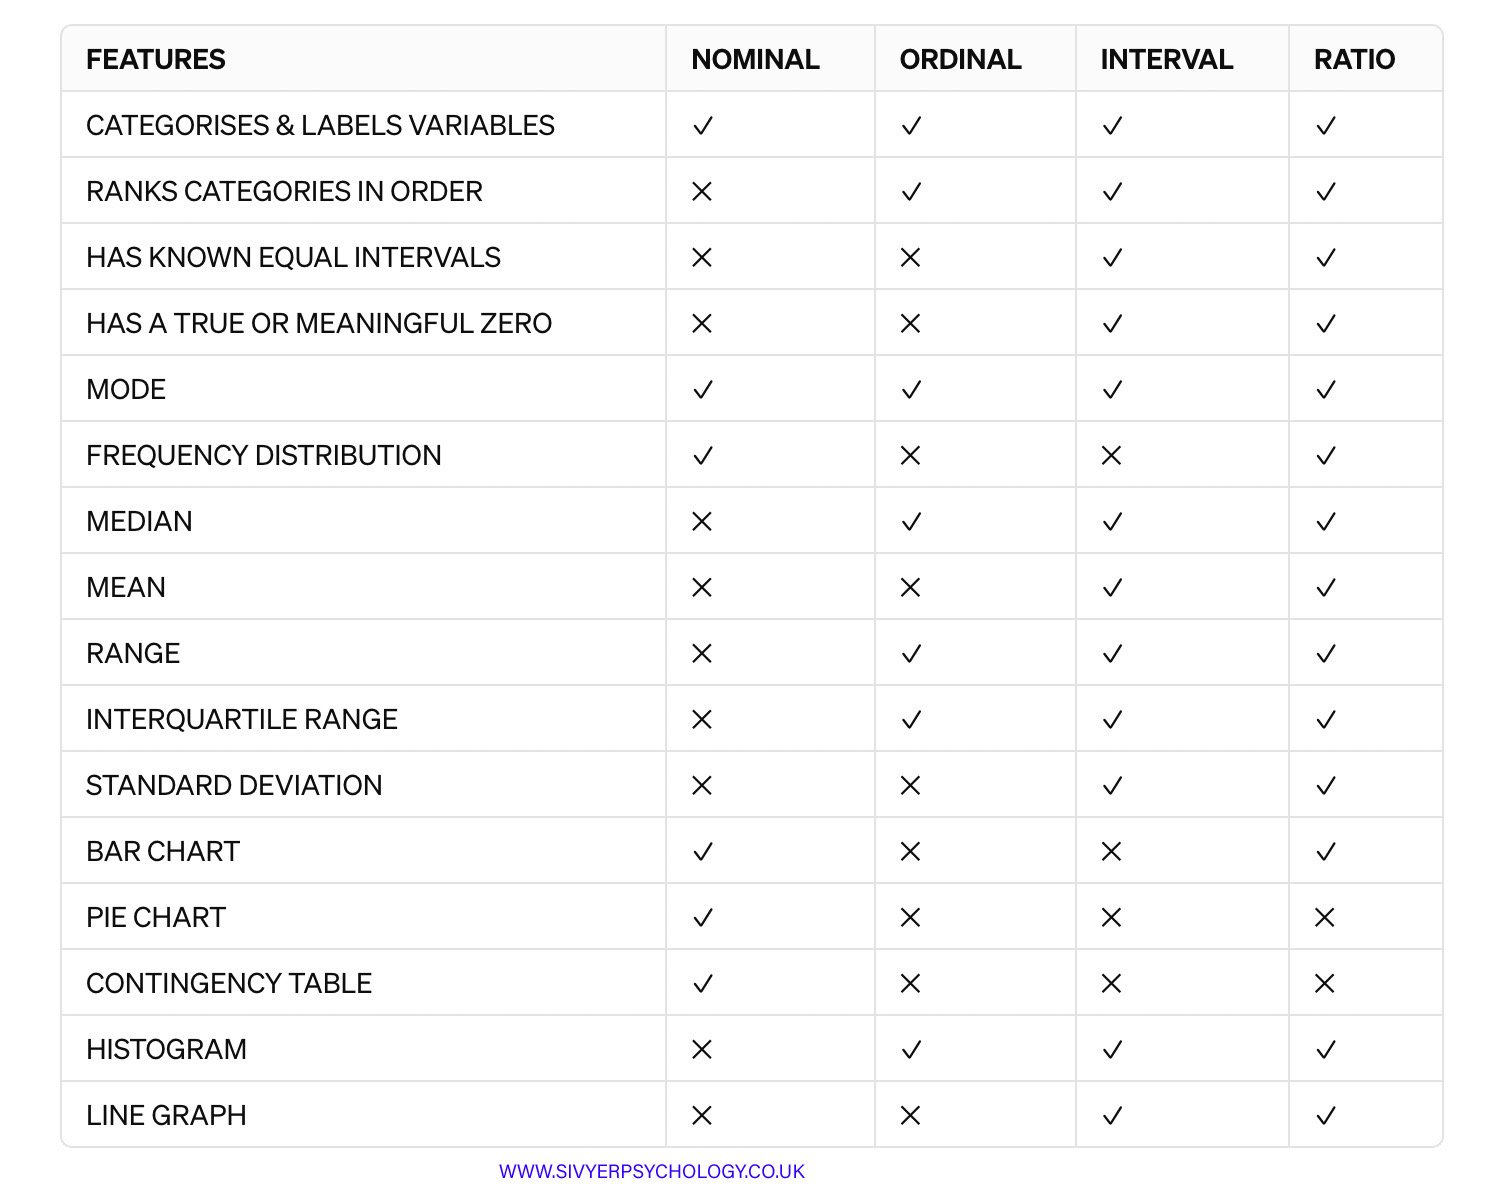
LEVELS OF MEASUREMENT FEATURES
PRIMARY AND SECONDARY DATA
When researching, you have to gather information and evidence from various sources.
Primary sources provide raw information and first-hand evidence. Examples include interview transcripts, statistical data, and works of art. A primary source gives you direct access to the subject of your research.
Secondary sources provide second-hand information and commentary from other researchers. Examples include journal articles, reviews, and academic books. A secondary source describes, interprets, or synthesises primary sources.
Primary sources are more credible as evidence, but good research uses both primary and secondary sources.

QUESTIONS ON PRIMARY AND SECONDARY DATA
Read the item and then answer the questions that follow.
In a study of social cognition, a researcher studied perspective-taking in children aged five years and nine years. An overall perspective-taking score was calculated based on answers to a questionnaire. A high score indicated good perspective-taking and a low score indicated poor perspective- The scores are shown in the table below.
TABLE 2

.
Explain why the table data is primary data, not secondary data. 2 MARKS.
Explain one strength of primary data. 3 MARKS
A researcher wanted to investigate whether a relationship existed between locus of control and resistance to social influence. Before the investigation began, he devised a questionnaire to measure locus of control.
Why would the researcher’s questionnaire produce primary data? 2 MARKS
Suggest one limitation of primary data. 2 MARKS
A psychologist is investigating the causes of addiction to gambling. She interviews people attending debt counselling for problem gamblers. She asks them to describe their family and early childhood, recording everything they say. She also looks at information in the gamblers’ debt counsellor reports.
Referring to this investigation, explain the difference between primary and secondary data. 4 MARKS
Please explain how the psychologist could continue her investigation by conducting a thematic analysis of the interview recordings. 6 MARKS.
META-ANALYSIS
A meta-analysis integrates findings from various research studies to draw a comprehensive conclusion with more statistical weight than any individual study. This method blends qualitative and quantitative data from selected studies to derive a singular, powerful conclusion. The strength of a meta-analysis lies in its ability to include a larger number of subjects and a wider diversity among them, enhancing the overall impact and reliability of the findings.
This analytical approach can compare and contrast findings from different research efforts, highlighting common threads, points of contention, or new insights that emerge from the collective data. It's particularly valuable when numerous studies explore the same question, pooling their data to form the most reliable evidence base.
Meta-analyses can contrast results from different studies and identify patterns among study results, sources of disagreement among those results, or other interesting relationships that may come to light with multiple studies.
Meta-analyses can be performed when multiple scientific studies address the same question, . Meta-analytic results are considered the most trustworthy source of evidence.
Meta-analysis is a powerful statistical technique designed to synthesize results from multiple studies to achieve several key objectives.
Here's a breakdown of its primary purposes:
STATISTICAL SIGNIFICANCE: To resolve discrepancies and conflicting outcomes among studies. By aggregating data, a meta-analysis can determine whether there is a statistically significant effect across all studies, even when individual studies may have reported different results.
GOOD MEASURE OF MAGNITUDE: To refine the understanding of how strong a particular effect or relationship is across different contexts. Meta-analysis calculates a pooled estimate, providing a more precise measure of effect size than any single study could offer.
OBJECTIVITY: To assess the consistency of findings across multiple studies. A meta-analysis evaluates the reliability of results by examining if similar methodologies yield similar outcomes, thereby verifying the robustness of research findings.
PREVALENCE: To ascertain the rate or frequency of a phenomenon, condition, or characteristic within a given population.
CULTURAL VARIABILITY: To explore how cultural contexts influence the outcomes of interest.
ADVANTAGES
Greater statistical power
Confirmatory data analysis
Greater ability to extrapolate to the general population affected
Considered an evidence-based resource
DISADVANTAGES
It is difficult and time-consuming to identify appropriate studies
Not all studies provide adequate data for inclusion and analysis
Requires advanced statistical techniques
Variability in the characteristics of study populations can introduce complexity.
While meta-analyses demand rigorous effort in study selection and advanced statistical skills, they stand as a cornerstone in evidence-based research, offering robust conclusions drawn from a broad spectrum of data.
META-ANALYSIS EXAMPLES

A META-ANALYSIS OF THE STRANGE SITUATION
Van Ijzendoorn & Kroonenberg examined almost 2,000 Ainsworth strange situation classifications obtained in 8 countries. Differences and similarities between distributions in sorts of samples were investigated using correspondence analysis. Aggregating samples per country and continent allowed for a firmer empirical basis for cross-cultural analysis. Substantial intracultural differences were established; in several instances, samples from one country resembled those in other countries more than they did each other. The data also suggest a pattern of cross-cultural differences, in which avoidant classifications emerge as relatively more prevalent in Western European countries and resistant classifications are relatively more frequent in Israel and Japan. Intracultural variation was nearly 1.5 times the cross-cultural variation.

META-ANALYSIS OF SCHIZOPHRENIA IN FAMILIES
QUESTIONS ON META-ANALYSIS
A Meta-Analysis pools the sample populations from different studies, such as randomised controlled trials, into one statistical analysis and treats them as one large sample population with one conclusion.
Please choose one option.
True
False
2. One potential design pitfall of Meta-Analyses that is important to pay attention to is?
Please choose one option.
If the authors appropriately combined studies, they did not compare apples and oranges.
If the authors used only quantitative data.
Whether it is evidence-based.
If the authors combined studies with conflicting results2.
THE STORY ABOUT DATA SO FAR
Qualitative data is non-numeric information. However, qualitative data must be turned into quantitative data for analysis. Qualitative data, which is non-numeric, can be coded quantitatively for analysis. However, this transformation doesn't alter its inherent qualitative nature but enables statistical evaluation. This ultimately means that all data is quantitative.
However, data that has its roots in the qualitative process are not considered real numbers, e.g., data derived from content analysis and thematic analysis.
Quantitative data are countable variables that contain numerical values.
Quantitative data splits into two main types: discrete (or categorical) and continuous. Discrete data refers to countable, distinct categories, while continuous data involves measurements on a scale that flows without breaks, allowing for any value within a range.
The different levels of measurement give different types of information about the data collected and determine how far they can be manipulated mathematically.
Nominal data is discreet/categorical data and has no numerical value.
Ordinal data is discreet/categorical data and has no measurable gaps,
Even though nominal & ordinal Data data can sometimes be numerical, not all mathematical operations can be performed on them because they are not real numbers.
Interval and ratio data are forms of continuous data. This refers to how data are measured.